Overview
System KPIs, sector share, validation gates, and a national demand sparkline — scope-labelled at ~88% of national.
Instrument-grade exploration of Irish synthetic electricity demand
System KPIs, sector share, validation gates, and a national demand sparkline — scope-labelled at ~88% of national.
RES, COM, PUB, IND and DAT breakdowns with target-vs-realised calibration and adoption summaries.

Hourly demand, wind, solar, gas, carbon and price — with synthetic-reference caveats where run8 requires them.
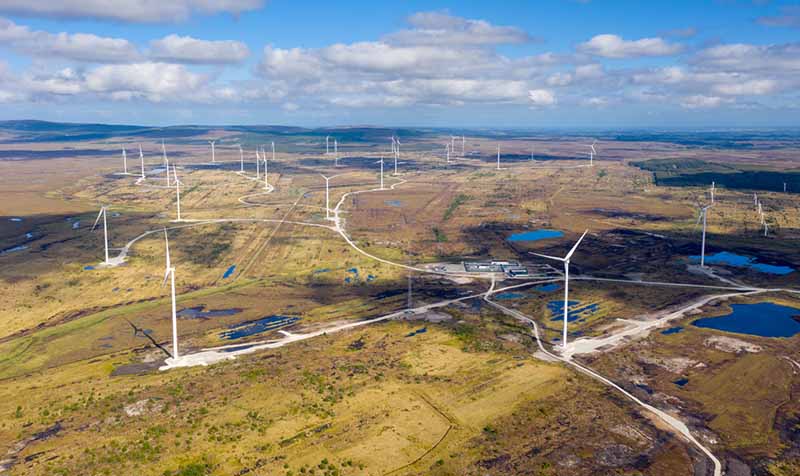
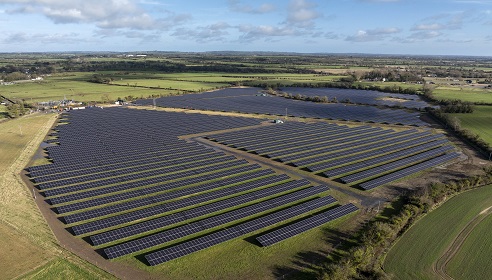
County choropleths, weather stations (real), and clearly flagged synthetic renewable farm layers.
Lineage browser: REAL, CALIBRATED, SYNTHETIC and COMPUTED — the integrity page every figure links back to.

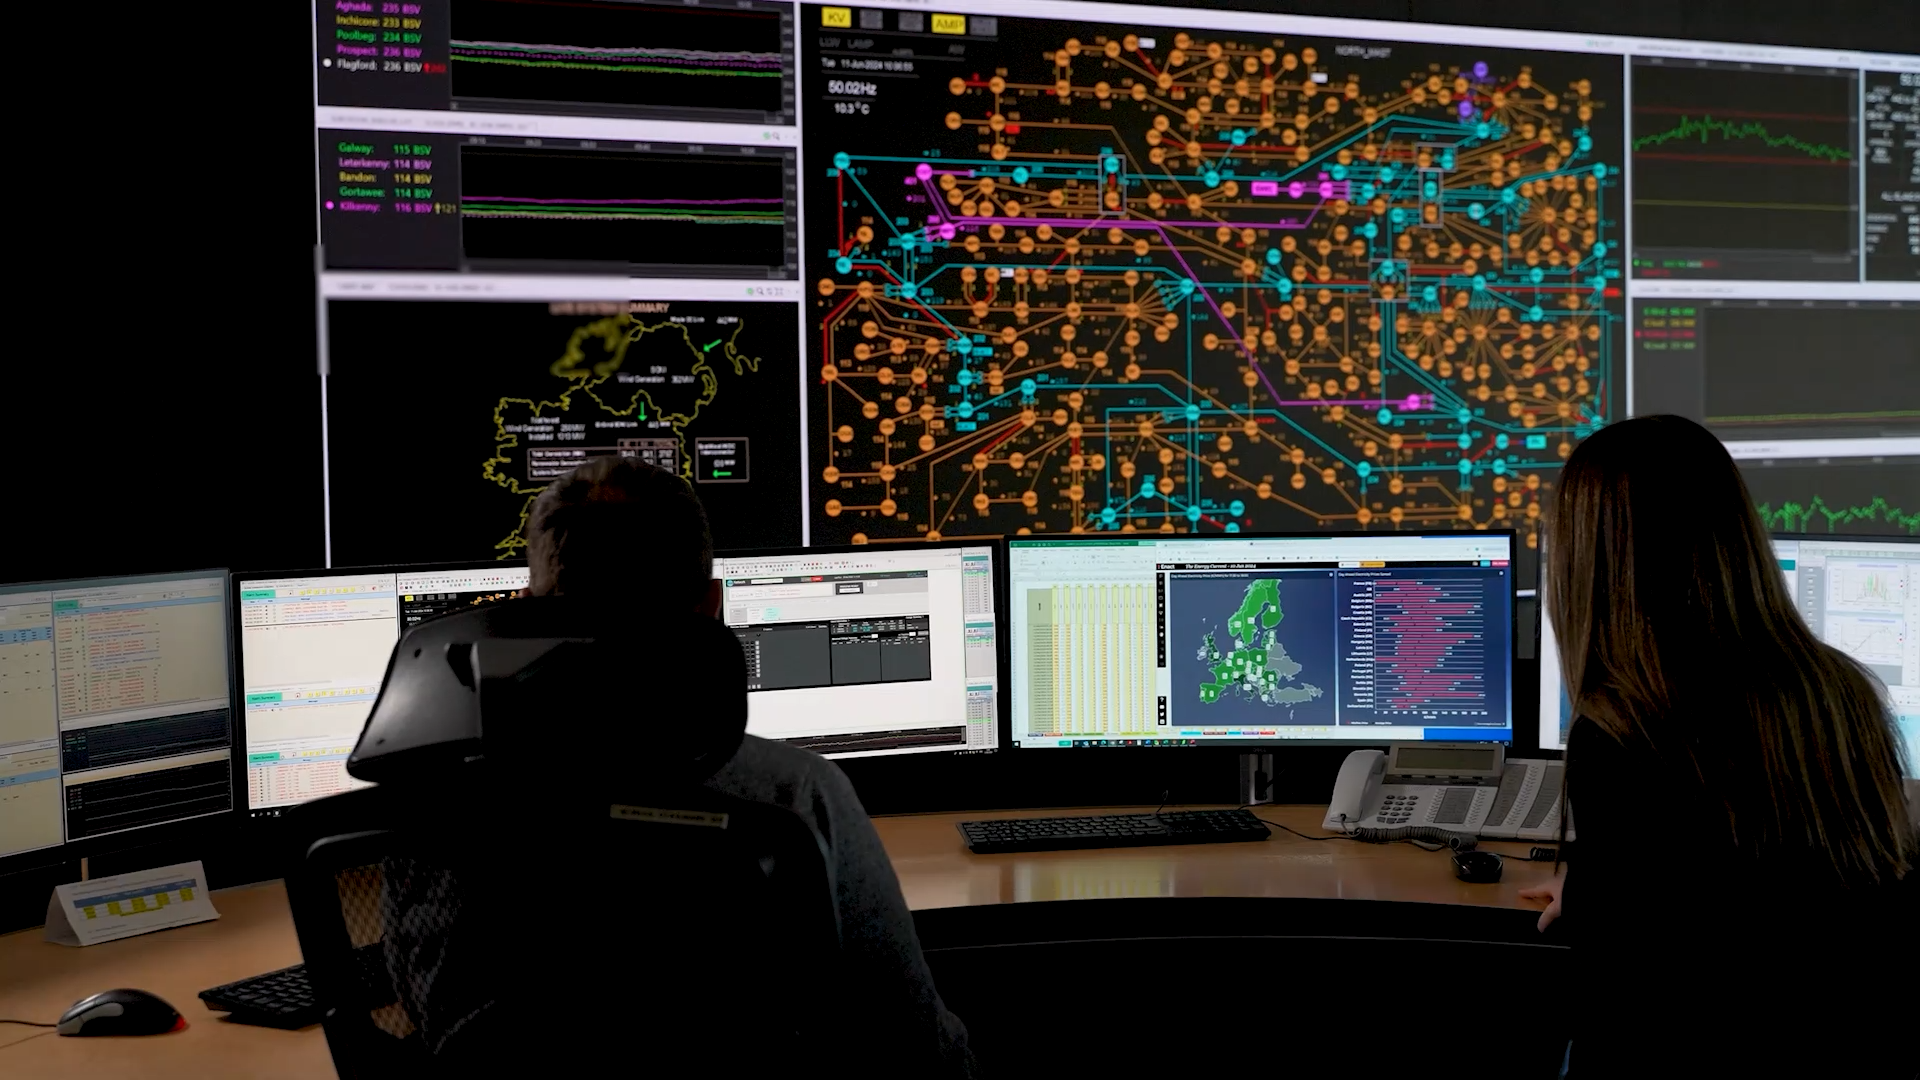
A read-only research dashboard for a reproducible synthetic Irish grid dataset. Every value is traceable to its class; synthetic fallbacks are labelled, not hidden.
hyperGrid presents SYNTH_GRID_IE: weather-driven hourly import, export, PV, heat-pump, EV and net demand for a 1% representative building sample (2022–2023), expanded to a national view. The platform covers building-sector and data-centre electricity only — approximately 88% of national consumption (~27.3 TWh/yr modelled at run8), not the full ~31.6 TWh national total. Design direction is “control-room calm”: dense, legible panels with provenance as a first-class visual element.
Three principles carried from the dataset’s no-fabrication standard into the interface.
Every number is reachable in one interaction: REAL, CALIBRATED, SYNTHETIC or COMPUTED, with source anchors from the SYNTH_GRID_IE lineage register.

National-style totals always carry the ~88% scope qualifier — modelled building and data-centre sectors, not headline “national electricity demand.”
Pre-aggregated rollups only; global_seed 20240101 and run8 build context on the Provenance page.
No per-request queries against the 437M-row hourly file.